FFT Investment Brief - Municipal Bonds–Still Important, but Getting Expensive
DOWNLOAD PDF
Summary
Municipal bonds are an important component of most US taxable portfolios. They are issued by numerous entities nationwide, and come with a variety of credit ratings, duration, and yield. Taxable investors gravitate towards municipal portfolios because of their favorable risk-reward profile, and especially due to their tax-advantaged yields. Some municipal securities may be exempt from local, state, and federal taxation, which can provide an after-tax yield advantage over other bonds of similar credit quality and duration. The market is deep and broad, and well understood.
However, for a variety of reasons, municipal bonds may no longer completely “sleep at night” money. LGL Partners continues to regard municipal bonds as important tools for US taxable investors, but we also encourage investors to think intelligently about their allocations and fully consider the landscape of risks.
A brief history
Unlike most other asset classes, municipal bonds were mostly unscathed by the 2008 financial crisis (they sold off, but recovered fairly quickly), but they did suffer from some lingering collateral damage nonetheless. Prior to 2008, investors had been able to confidently buy bonds insured by a variety of insurers. In the unlikely event that the issuer defaulted, a highly-rated bond insurer would step in and ensure the repayment of principal and interest. Unfortunately, most of those insurers also had been insuring various sorts of asset-backed securities. That business proved to be untenable during the crisis, and has not recovered.
At the same time, the financial crisis brought about lingering high unemployment which threatens issuers’ the tax revenue bases, increasing the risk of default for general obligation bonds.
That situation caused some analysts, notably Meredith Whitney—who had made accurate financial industry calls in the recent past—to assert at the end of 2010 that there would be hundreds of billions of dollars of defaults over the ensuing 12 months. In hindsight, that didn’t come to pass, but Ms. Whitney’s prognostication seemed well timed: she made her call after the municipal market had already sold off 7.5% over the prior month.
The current economic backdrop
In 2010, Meredith Whitney’s pessimism was not entirely unwarranted. Things looked gloomy a year ago. However, the situation has improved since then. Payment defaults have decreased, year over year, state and local tax revenues are increasing again, and states are engaged in initiatives such as pension reform and bondholder prioritization.
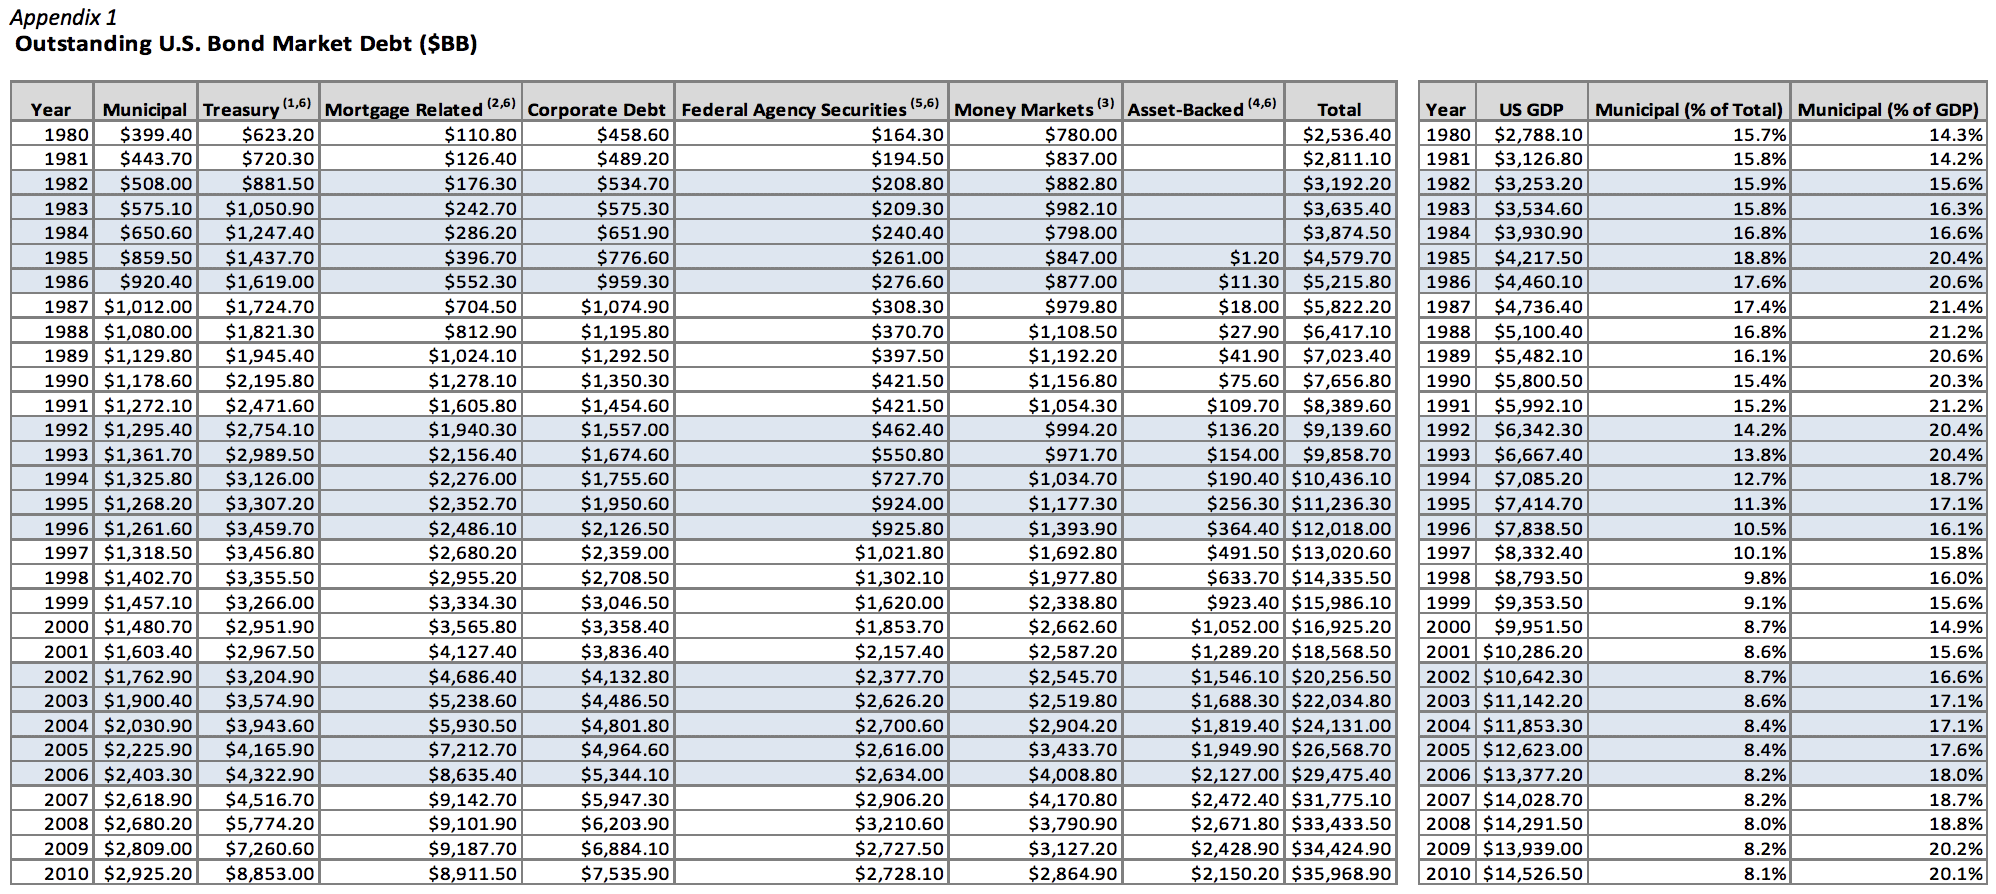
Investors should also consider debt sustainability. We have written previously about this subject in earlier investment briefs. For example, see LGL Partners Investment Brief, The cost of dollars. We note that the US government, which enjoys the power of the printing press, can leverage monetary policy in conjunction with fiscal policy and spending. Municipals issuers have less flexibility, but have been less spendthrift. While all debt in the US has increased over the past 30 years, municipal debt has decreased as a percentage of total debt, and has stayed relatively constant with respect to GDP. This data can be seen in the appendix.
Investors have been clamoring for municipal bonds. $1.74BB went into municipal funds earlier in January, 2012—roughly 16% of all the flows into long term mutual funds. That is on top of $5BB in December, 2012, which was the highest amount in 16 months.
Yields and recent price performance
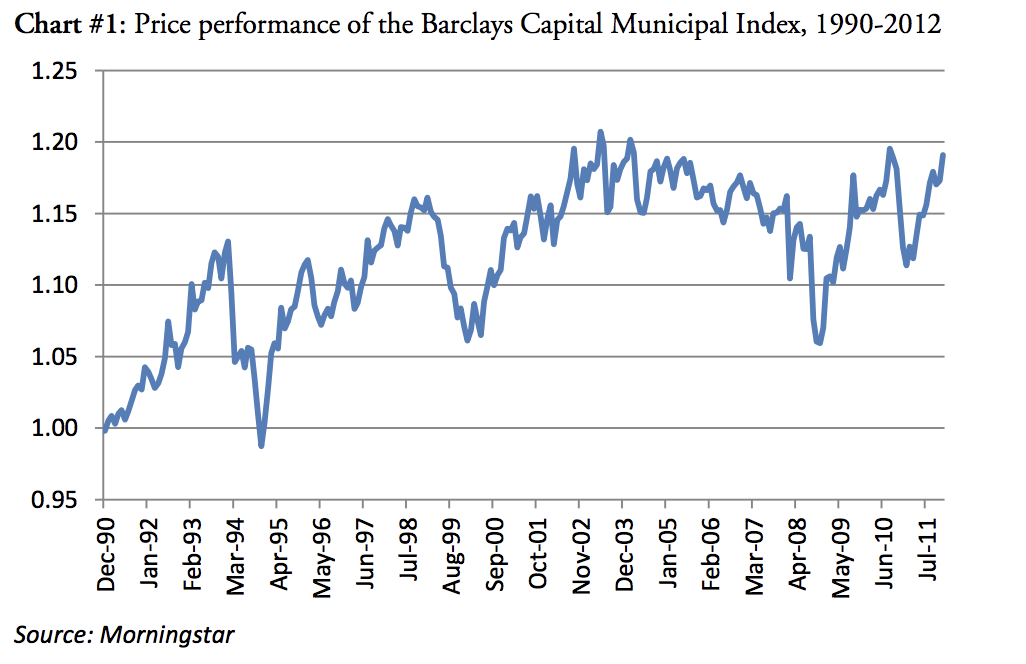
Since December, 2010, municipals have rallied by 14%. It is important to put this move, and the November, 2010 decline in perspective.
The chart below shows the capital appreciation in the Barclays Capital Municipal index over the past two decades. Over that time, the annualized standard deviation of price moves was around 4.4%. The move over the past year, therefore, is a three standard deviation event—something that would be expected to happen less than 1% of the time.
Investors don’t typically look to municipal bonds for capital appreciation; rather, they are attracted to taxadvantaged, stable yields. Currently, the S&P National AMT-Free Municipal Series 2021 index yields 2.55%, a tax-equivalent yield of 4.65% vs. a 1.8% yield for the equivalent 10 year Treasury.
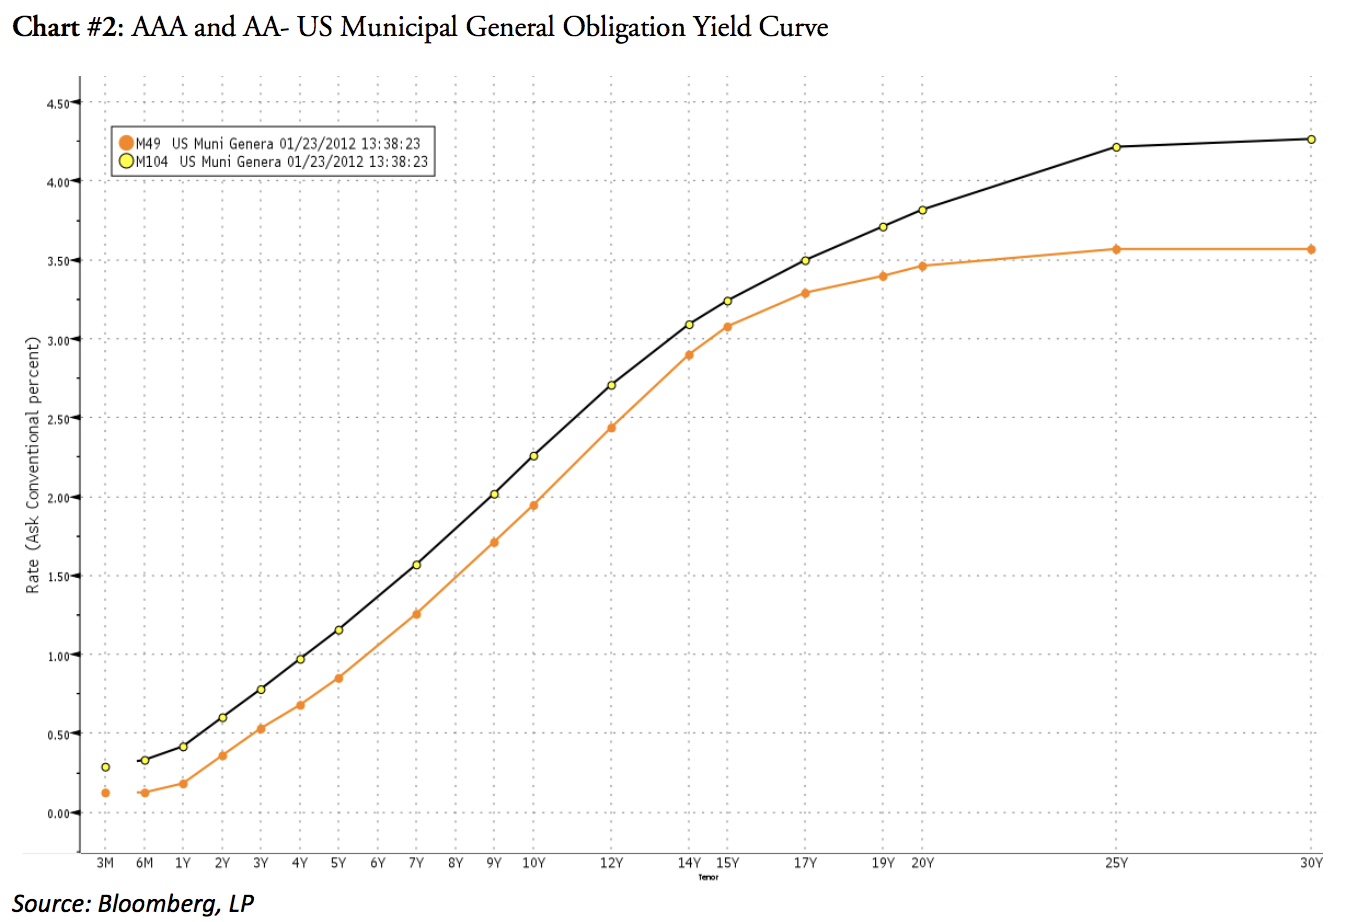
The yield curve of AAA and AA- municipal bonds is shown below.
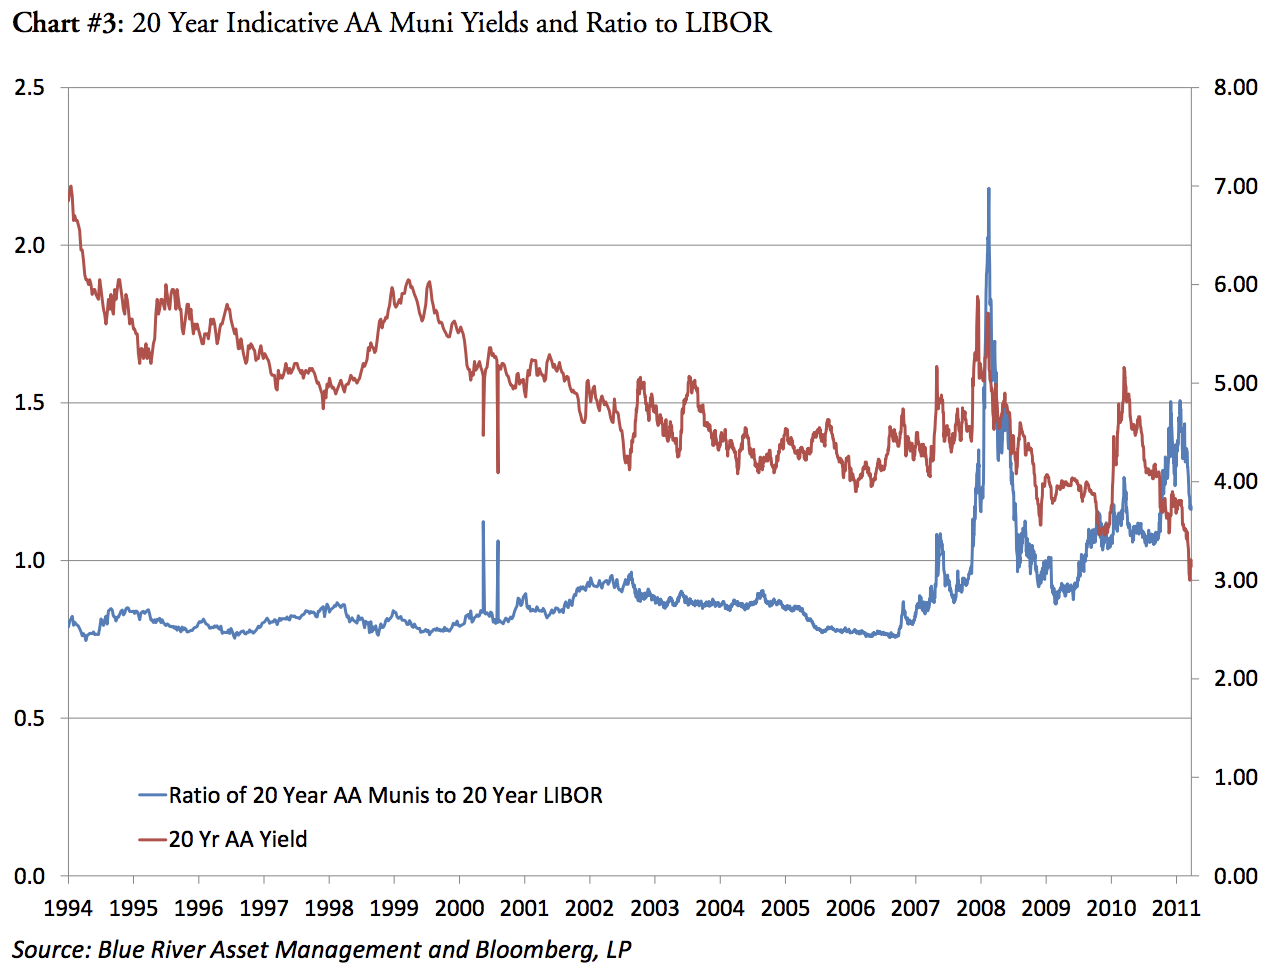
Is there value in municipals, given their movement over the past year? Yes, but with some caveats. As the following chart shows, municipals are near a historic low level of yield. However, their spread to LIBOR of similar duration, while lower than it had been, is still higher than it has been both before and after the crisis of 2008. We can interpret this to mean that while absolute yields are low, municipals are still trading at a discount to the floating rate benchmark, reflecting still heightened risk sensitivity. At the same time, LIBOR itself is historically low. This may mean that as LIBOR eventually increases, municipal yields may not rise in tandem, but rather their spread will be compressed.
Summary
A well-diversified portfolio of shorter duration, high quality bonds, laddered by maturity, can make sense for a number of portfolios. Alternatively, investors can gain access to the asset class through low cost ETFs or mutual funds that provide many of the advantages of holding securities outright.
However, the recent compression in yields and dramatic price action in the municipal market has to be considered by investors. Based on recent movements, LGL recommends a minor underweight to the asset class (but municipal bonds remain a key part of our strategic asset allocation.) At the same time, we continue to monitor the market to identify opportunities to scale back into positions.
Notes
- Interest bearing marketable public debt.
- Includes GNMA, FNMA, and FHLMC mortgage-backed securities and CMOs, and CMBS, and private-label MBS/CMOs.
- Includes commercial paper, bankers acceptances, and large time deposits.
- Includes auto, credit card, home equity, manufacturing, student loans and other; CDOs of ABS are included
- Due to FAS 166/167 changes, the GSE debt category in the Federal Reserve is no longer our source for agency debt going forward from Q1 2010. Contains agency debt of Fannie Mae, Freddie Mac, Farmer Mac, FHLB, the Farm Credit System, and federal budget agencies (e.g., TVA)
- Further breakdowns of these categories may be found in their respective sections on SIFMA statistics. See US Treasury Issuance, Gross & Net; US Mortgage-Related Outstanding; US Agency Debt Outstanding; and US ABS Outstanding.
Sources
U.S. Department of Treasury, Federal Reserve System, Federal agencies, Dealogic, Thomson Reuters, Bloomberg, Loan Performance and SIFMA
Forbes Family Trust (“FFT”) is an SEC registered investment adviser. FFT and its representatives are in compliance with the current registration and notice filing requirements imposed upon registered investment advisers by those states in which FFT maintains clients. FFT may only transact business in those states in which it is notice filed, or qualifies for an exemption or exclusion from notice filing requirements. Any subsequent, direct communication by FFT with a prospective client shall be conducted by a representative that is either registered or qualifies for an exemption or exclusion from registration in the state where the prospective client resides. For information pertaining to the registration status of FFT, please contact FFT or refer to the Investment Adviser Public Disclosure web site (www.adviserinfo.sec.gov).
For additional information about FFT, including fees and services, send for our disclosure brochure as set forth on Form ADV using the contact information herein. Please read the disclosure brochure carefully before you invest or send money.
For more information, please visit our website at www.ForbesFamilyTrust.com.
The information provided herein is general in nature and is not intended to be, and should not be construed as, investment, legal or tax advice. FFT makes no warranties with regard to the information or results obtained by its use and disclaims any liability arising out of your use of, or reliance on, the information. All summary, prices, quotes, and statistics have been obtained from sources deemed to be reliable, but we do not guarantee their accuracy or completeness, any yield referenced is indicative and subject to change. Past performance is not a guarantee of future results.
This material is not intended as an offer or solicitation for the purchase or sale of any financial instrument. Private Investments may engage in leveraging and other speculative practices that may increase the risk of investment loss, can be highly illiquid, are not required to provide periodic pricing or valuations to investors and may involve complex tax structures and delays in distributing important tax information. Typically such investment ideas can only be offered to suitable investors through a confidential offering memorandum which fully describes all terms, conditions, and risks. IRS Circular 230 Disclosure: FFT does not provide tax advice. Accordingly, any discussion of U.S. tax matters contained herein (including any attachments) is not intended or written to be used, and cannot be used, in connection with the promotion, marketing or recommendation by anyone unaffiliated with FFT of any of the matters addressed herein or for the purpose of avoiding U.S. tax-related penalties.
Not FDIC Insured. No Bank Guarantee. May Lose Value
©2011 FFT