FFT Investment Brief - The Cost of Market Timing
DOWNLOAD PDF
Summary
In a year like 2018, when volatility has returned to equities (VIX above 20 for much of the year, at levels not seen since 2015/2016) and almost every global asset class showing stress, with markets from equities to bonds recording negative dollar returns, it might be tempting to consider different strategies for investing. An approach sometimes bandied about is simply to take money off the table (eliminate risk assets and go to cash), wait things out, and put exposure back on when the dust settles. “Easier said than done” doesn’t really capture how hard this strategy is to execute. In fact, the numbers suggest that it is likely self-defeating. Why? Simply because large up moves for the markets are often found in the midst of otherwise turbulent markets, sometimes in an isolated fashion; missing these solitary up days turns out to make a profound difference in realized results over the long-term. Market timing costs investors money. The data make this clear.
In this brief we decompose the returns within notable periods in the US equity market. We look far back—to the advent of the S&P500 index—as well as more specific periods of significance over that time. Through each, we identify the best 10 days and the worst 10 days, and then present the results of missing the N best days. The results are striking—it doesn’t take missing out on many days to really decimate the returns from investing in equities. Most returns for equity investors come from just a miniscule portion of the trading days. Missing these can be the difference between generating wealth over multiple market cycles and otherwise disappointing results.
We consider:
- The S&P 5001 since 1928
- The S&P 500 since the start of the so-called Dot-com ‘bubble’ (understood to start in January 1995)
- The current bull market in equities (understood to start in March 2009)
- The Great Depression (October 1929 through October 1939)
- The 1970s Oil Crisis (November 1973 to December 1979)
- 2017
- 2018 year to date (through November 21)
Returns are found within turbulence
19th century prospectors knew that you had to shake things up—swirl the water around—to find nuggets of gold. Investing isn’t like prospecting—we strongly endorse thoughtful long-term allocations to generate wealth—but markets don’t deliver returns in a predictable fashion. In fact, the shiniest returns have been found within some of the most tumultuous periods.
Since Inception of the SPX Index in 1928
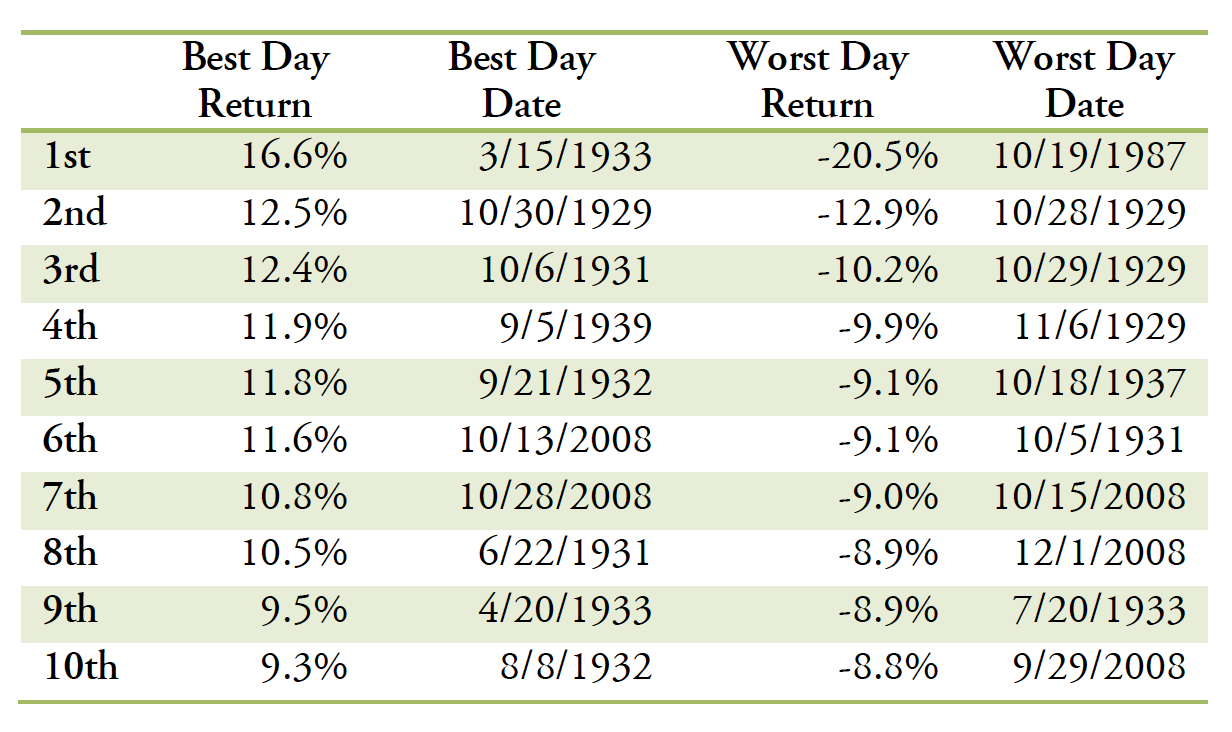
Not only did each of best 10 days in the history of the SPX index occur during either the Great Depression or Great Recession2, of the 50 best days, only four occurred outside these tumultuous periods.
Volatility cuts both ways, however. It often is the case that sharp down days, which occur during bouts of heightened volatility, are accompanied by upside volatility: 12 of 20 best days occurred within two weeks of one of top 20 worst days. Further, some of the best days occurred along with the worst days in the same tight window period, e.g. October 2008 saw the 6th and 7th best days, but also the 7th worst day of the S&P500 over 90 years.
Of course, the worst day in the history of the S&P500 was the so-called “Black Monday” of October 1987, where the S&P500 lost 20% in a single day, as world markets crashed. The exact causes of the crash are unclear, but possible reasons include computerized trading pernicious effects from portfolio insurance strategies, overvaluation, and the simply the cascading impact of fear and uncertainty.
The Great Depression was truly one of the most unfavorable economic climates we’ve ever seen; lives were destroyed during it. While capital markets have evolved considerably since then, market behavior hasn’t changed all that much, as the experiences of 1987 or 2008 attest.
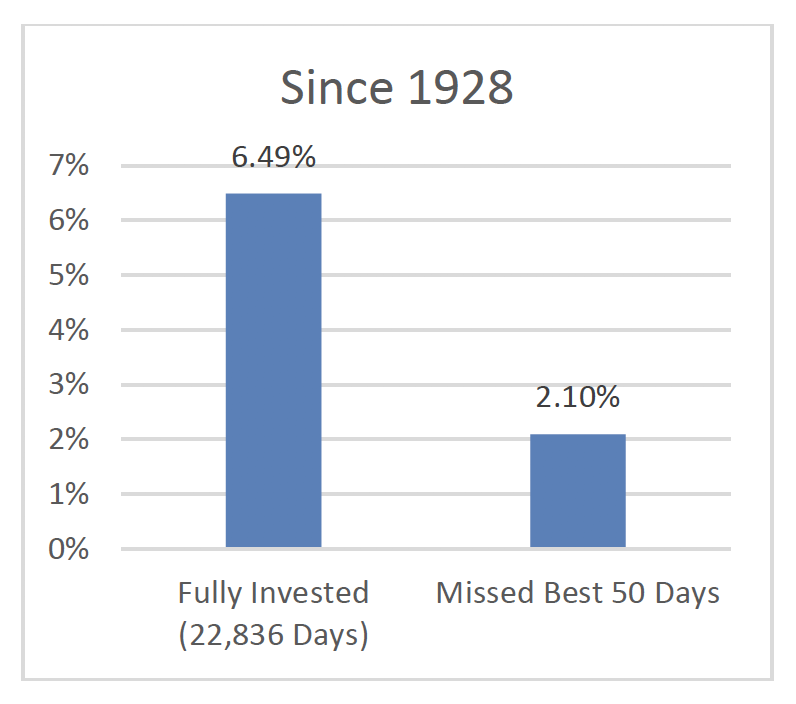
Over the course of the last 22,836 trading days (91 years), missing the very best 50 days (less than 1% of the time) means the difference between a 6.5% annualized return (about 10% with dividends), and a 2.1% annualized return (about 5.6% with dividends).
That difference means a $1 investment would grow to $5,844 vs. just $142. That is the power of compounding.
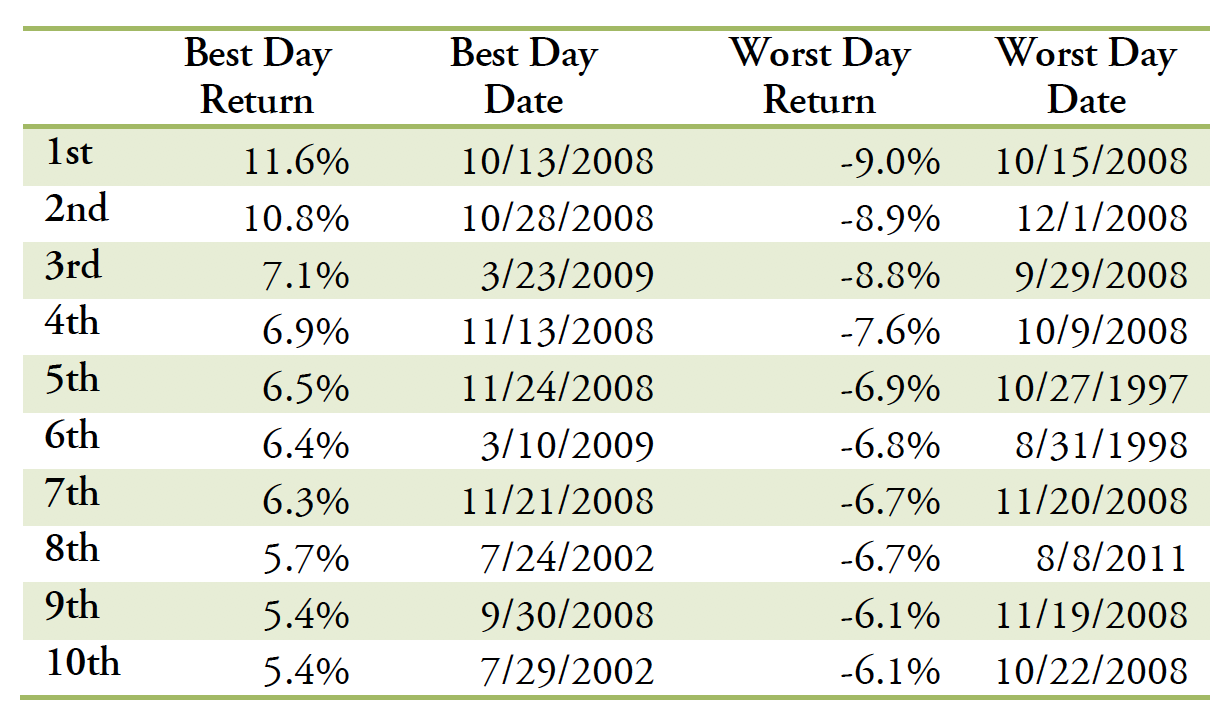
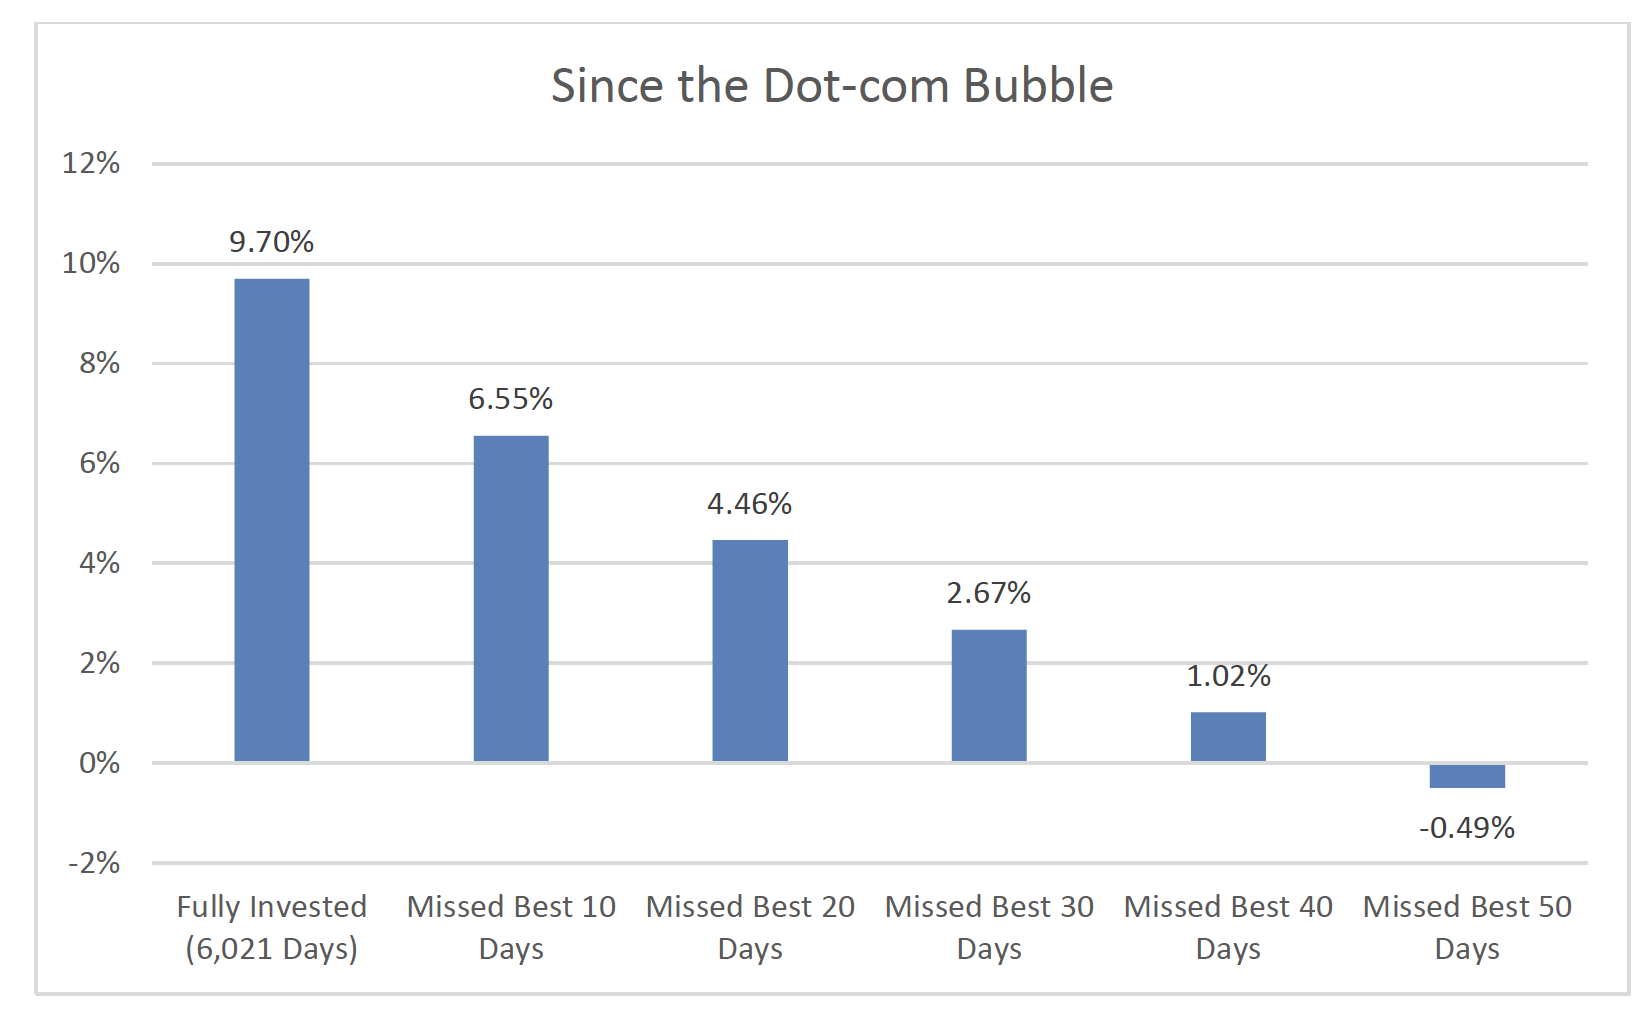
Since the Dot-com Bubble (January 1, 1995 – November 21, 2018)
The last 25 years or so spanned several market cycles: manias and panics, and some of the most significant bull and bear markets seen in several decades.
Perhaps surprisingly, the best days to be invested were confined to a small sliver of that period: fully 9 of the 10 best days occurred between Q3 2008 and Q1 2009, not during the heady days of the Dot-com ‘bubble’ of the late 1990s and not during the ebullience of the middle 2000s when the Greenspan Fed stoked credit and inflated a wide swath of global asset prices.
Bull and bear markets in detail
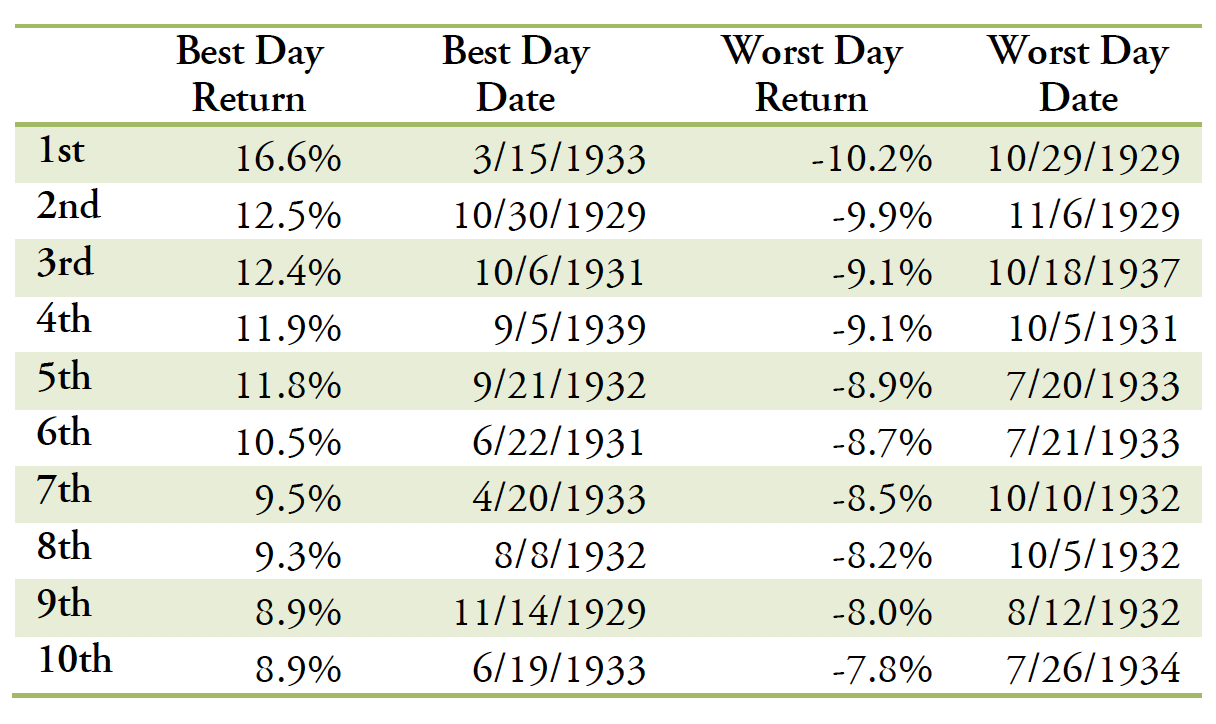
Great Depression (October 29, 1929 – October 28, 1939)
The Great Depression was one of the worst periods of American economic history, but capitulation during this period could have led to significant opportunity cost as some of the best S&P 500 days during the slump returned over +10%. Moreover, the magnitude of the 10 best days was meaningfully larger than the corresponding 10 worst days.
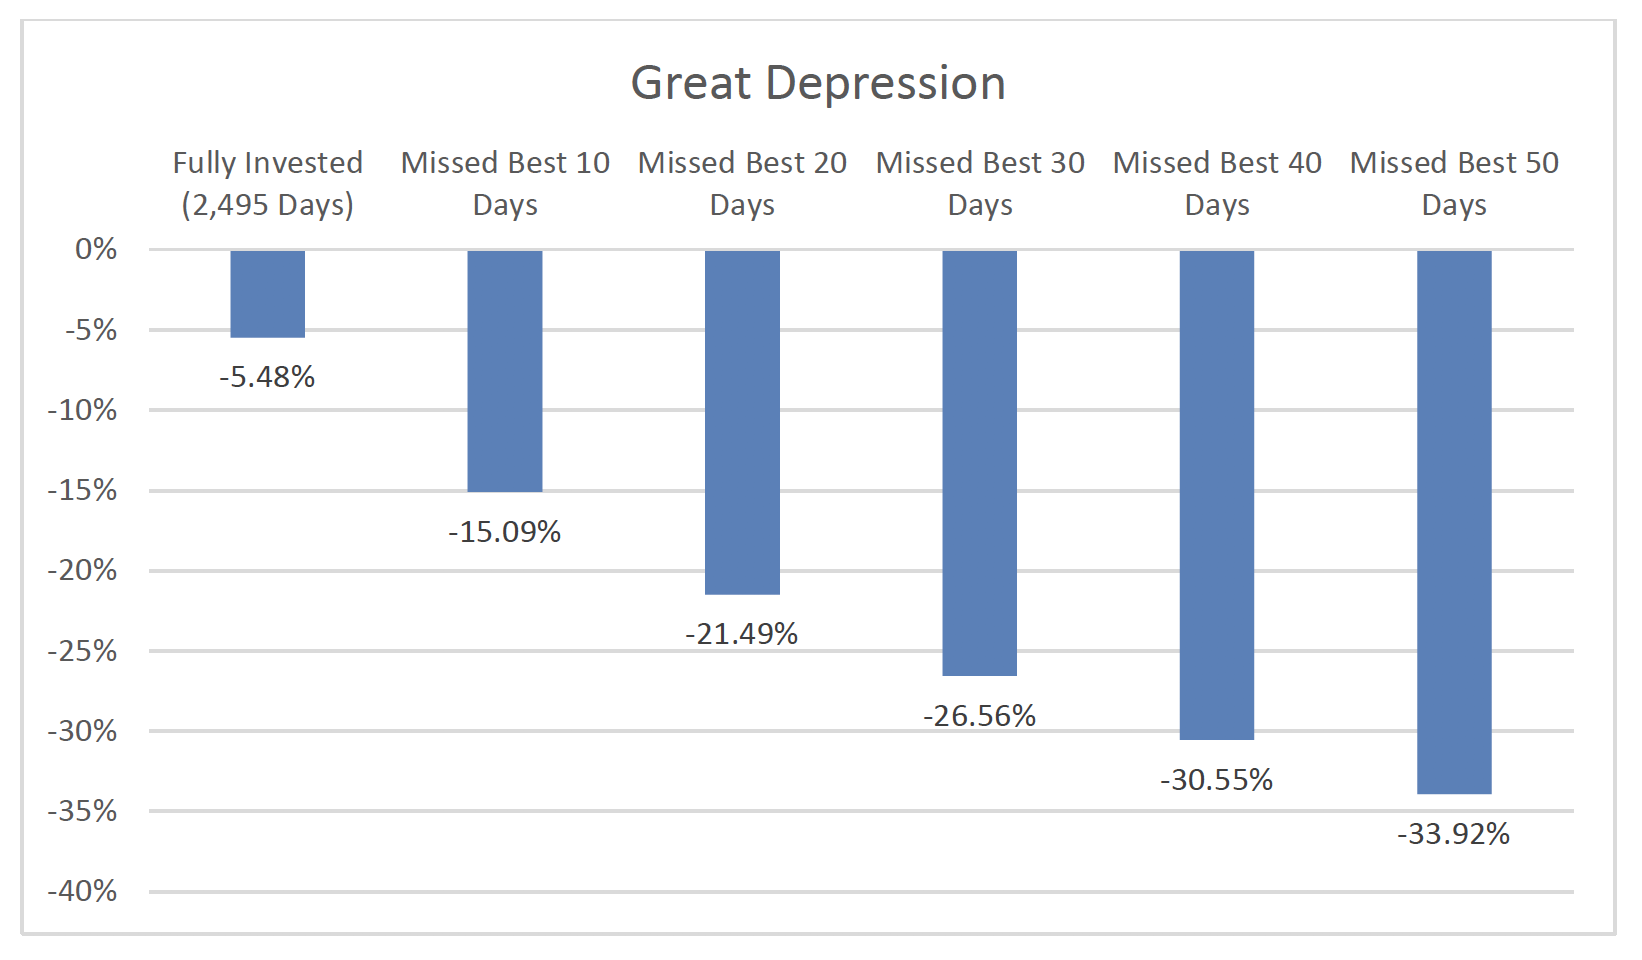
The decade of the Great Depression comprised several fits and starts for the market; holding equities over those 10 years would have resulted in significant losses, annualizing at -5.5%. However, in the face of this acute volatility, missing the 10 best days would have been profoundly worse—a difference of almost 10% per year, which is the difference between a merely painful loss of wealth and a ruinous one.
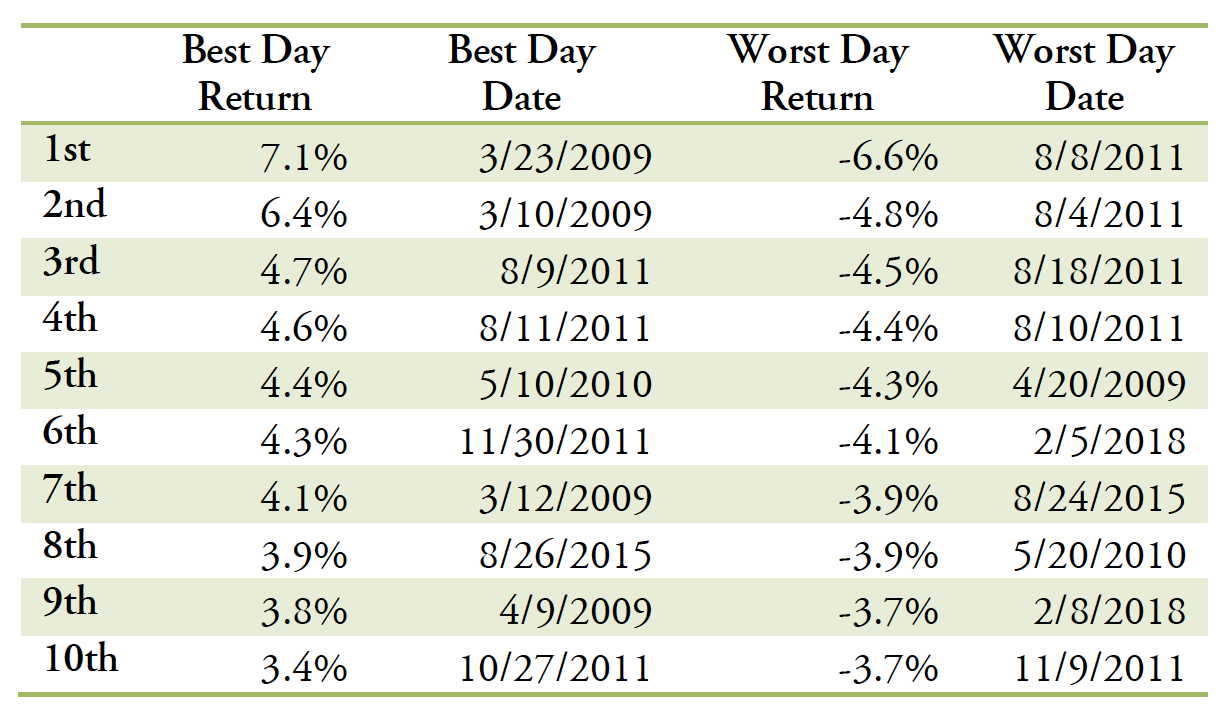
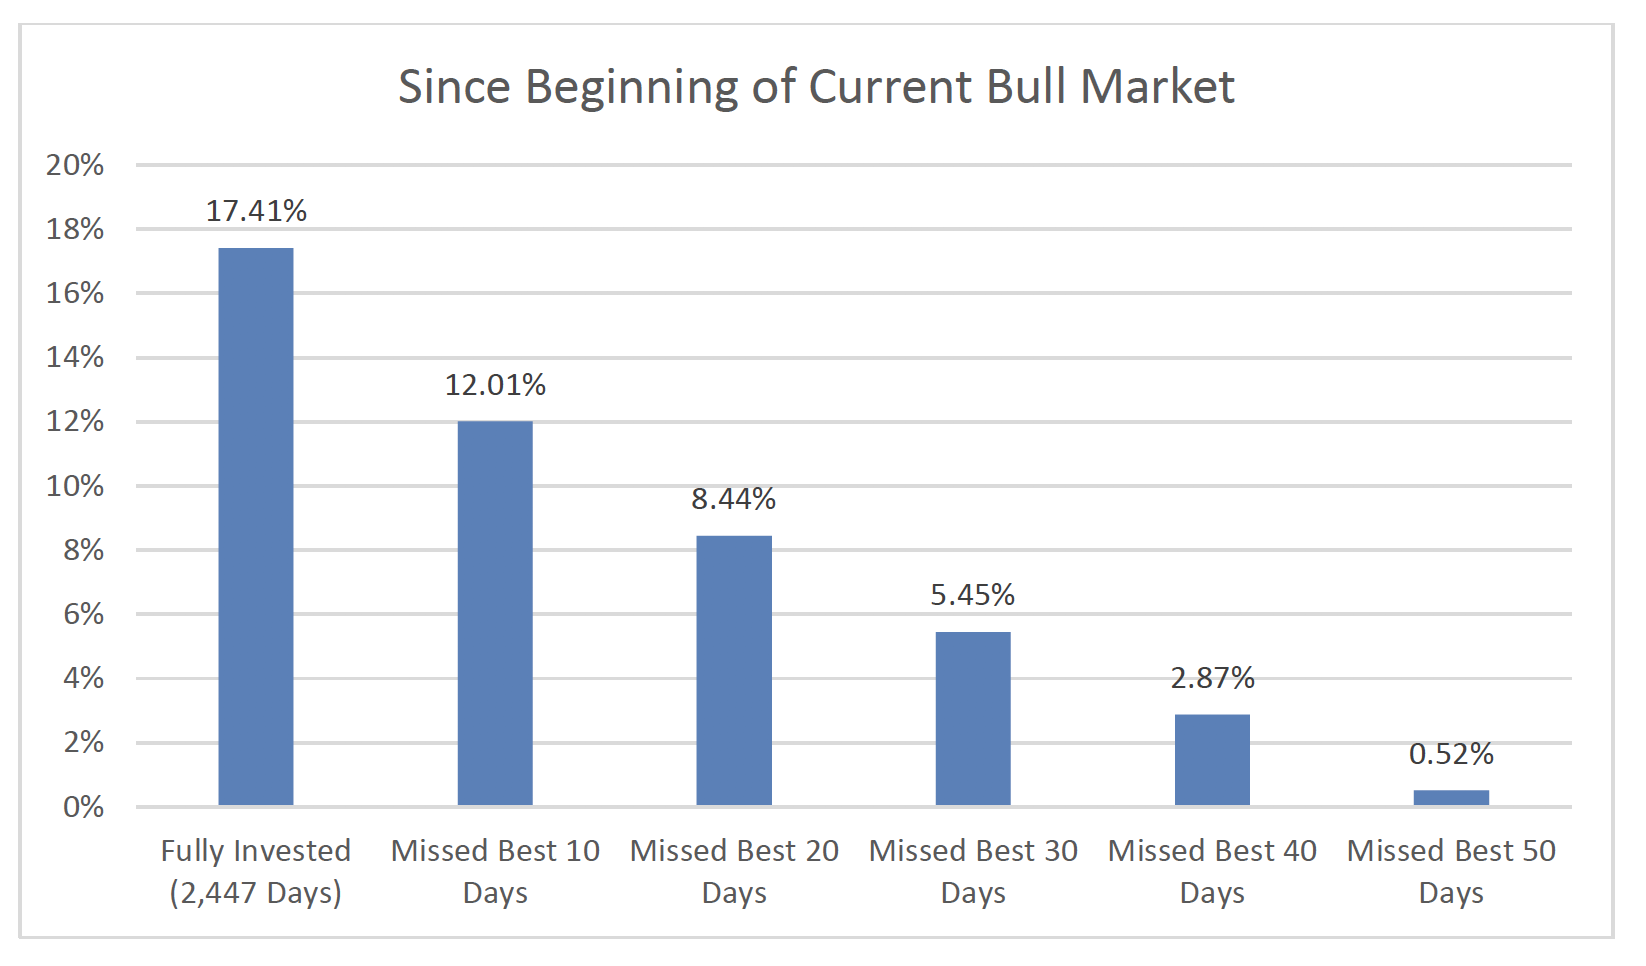
Current Bull Market (March 9, 2009 – November 21, 2018)
The current bull market, still going strong, is finally showing some volatility. It doesn’t look like it is going to end just yet, the travails of October 2018 aside.
This has been a remarkable period, over which the S&P 500 rose from under 700 to over 2,700.
Averaging 19, the VIX over this time was near its long-run average level, although volatility left the equity markets by the end of 2011. As we have seen in other periods, the best (and worst days) tend to be found within such spells.
Good years and bad years
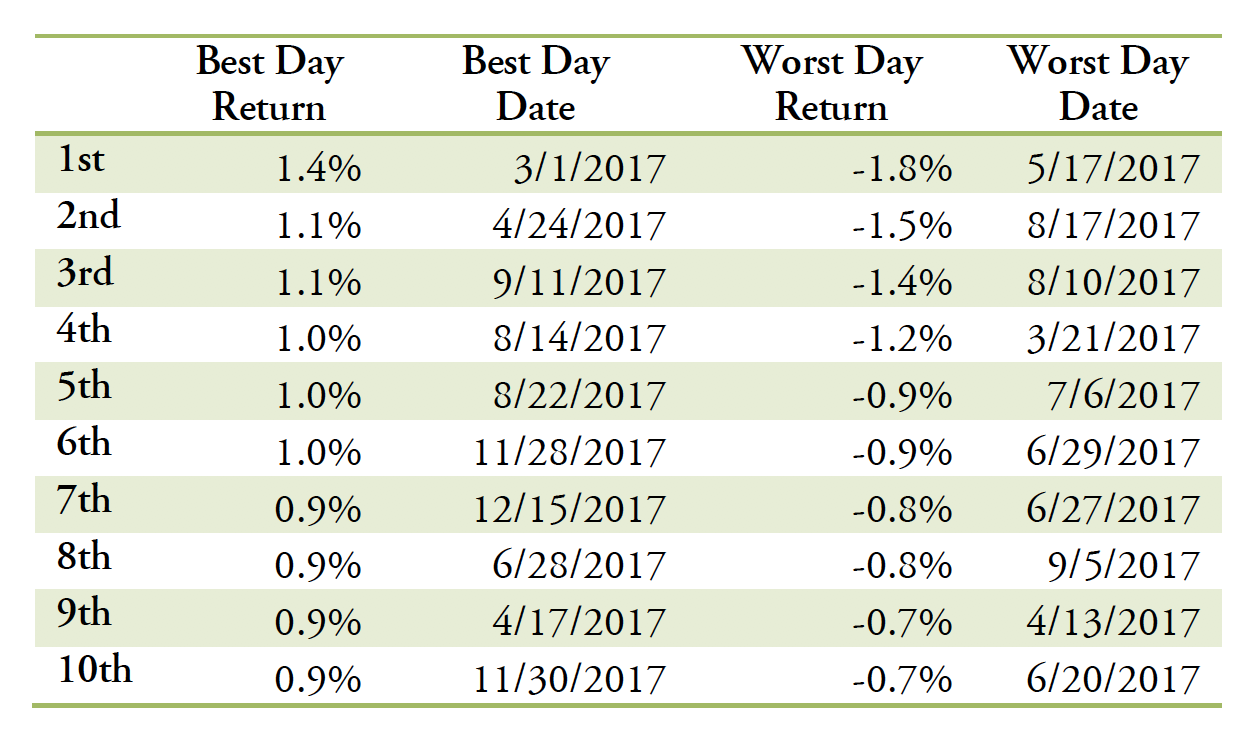
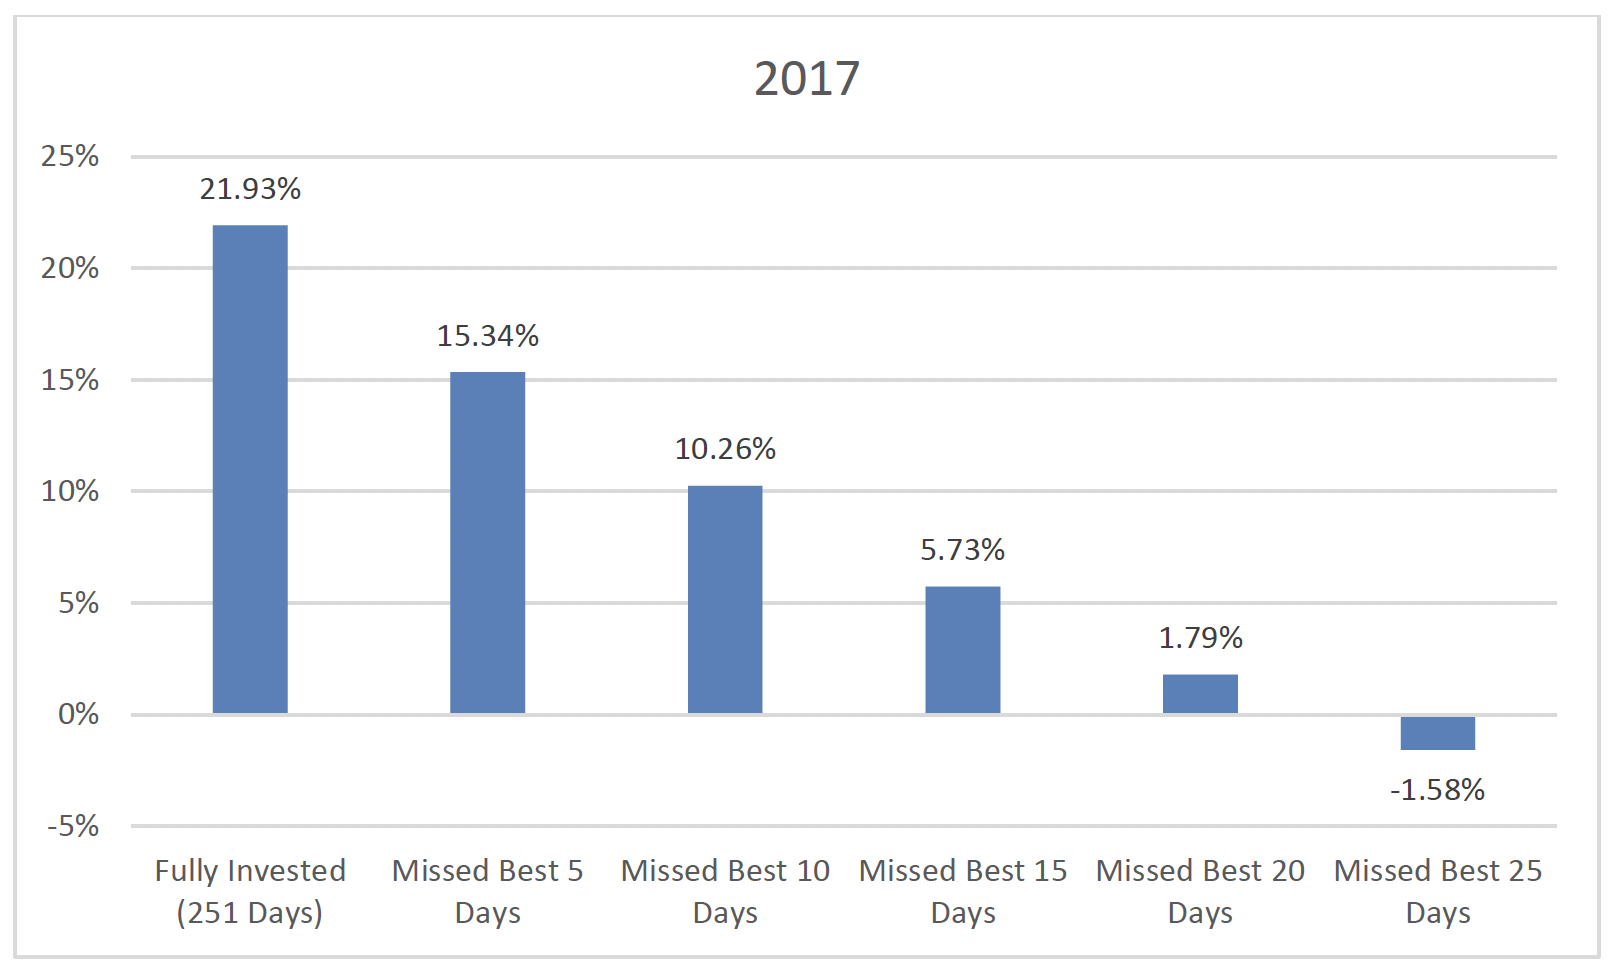
2017
2017 is a distilled example of another sort of market regime: one in which the S&P 500 steadily rose, recording a nearly 22% total return for the year, with an average volatility, as measured by the VIX index, of around 11. With lower volatility, we observe that any large moves, up or down, are not nearly as large as when markets are choppier. Still, missing just the five best days in a year like 2017 (there are generally around 252 trading days in a year, so five days out of 252 is around 2% of the time) would have led to a 6.6% lower return than if one was invested throughout the whole year.
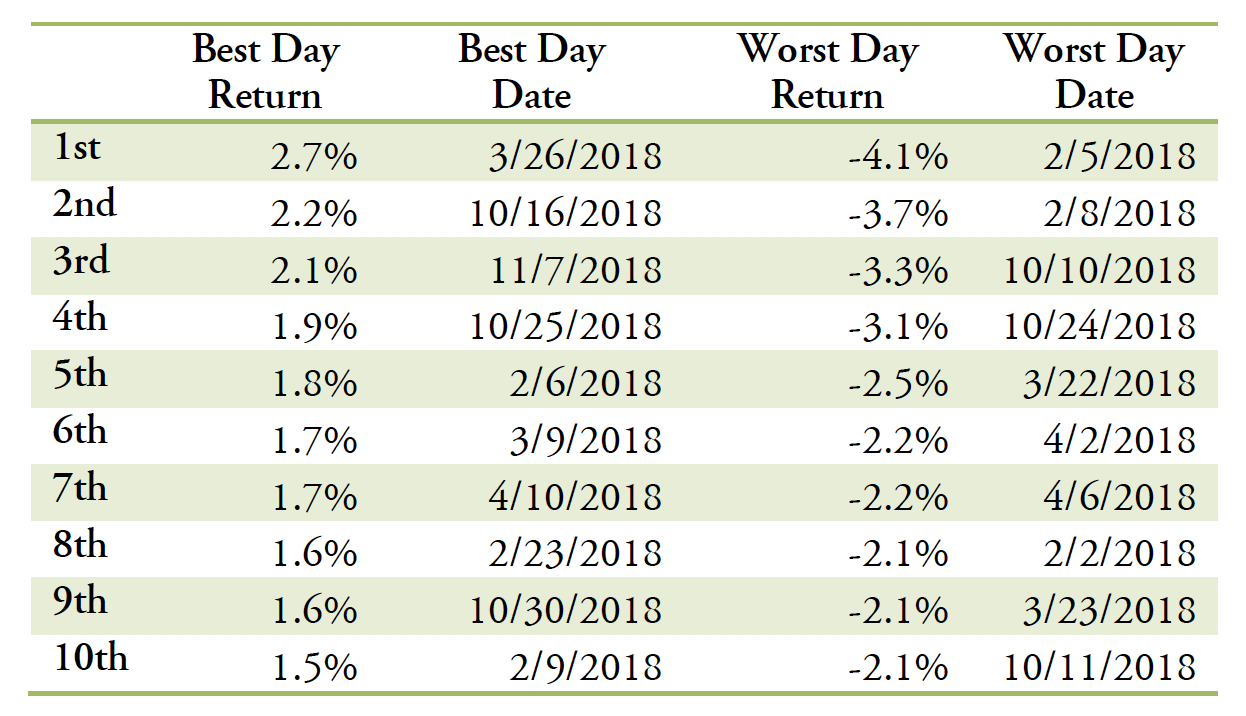
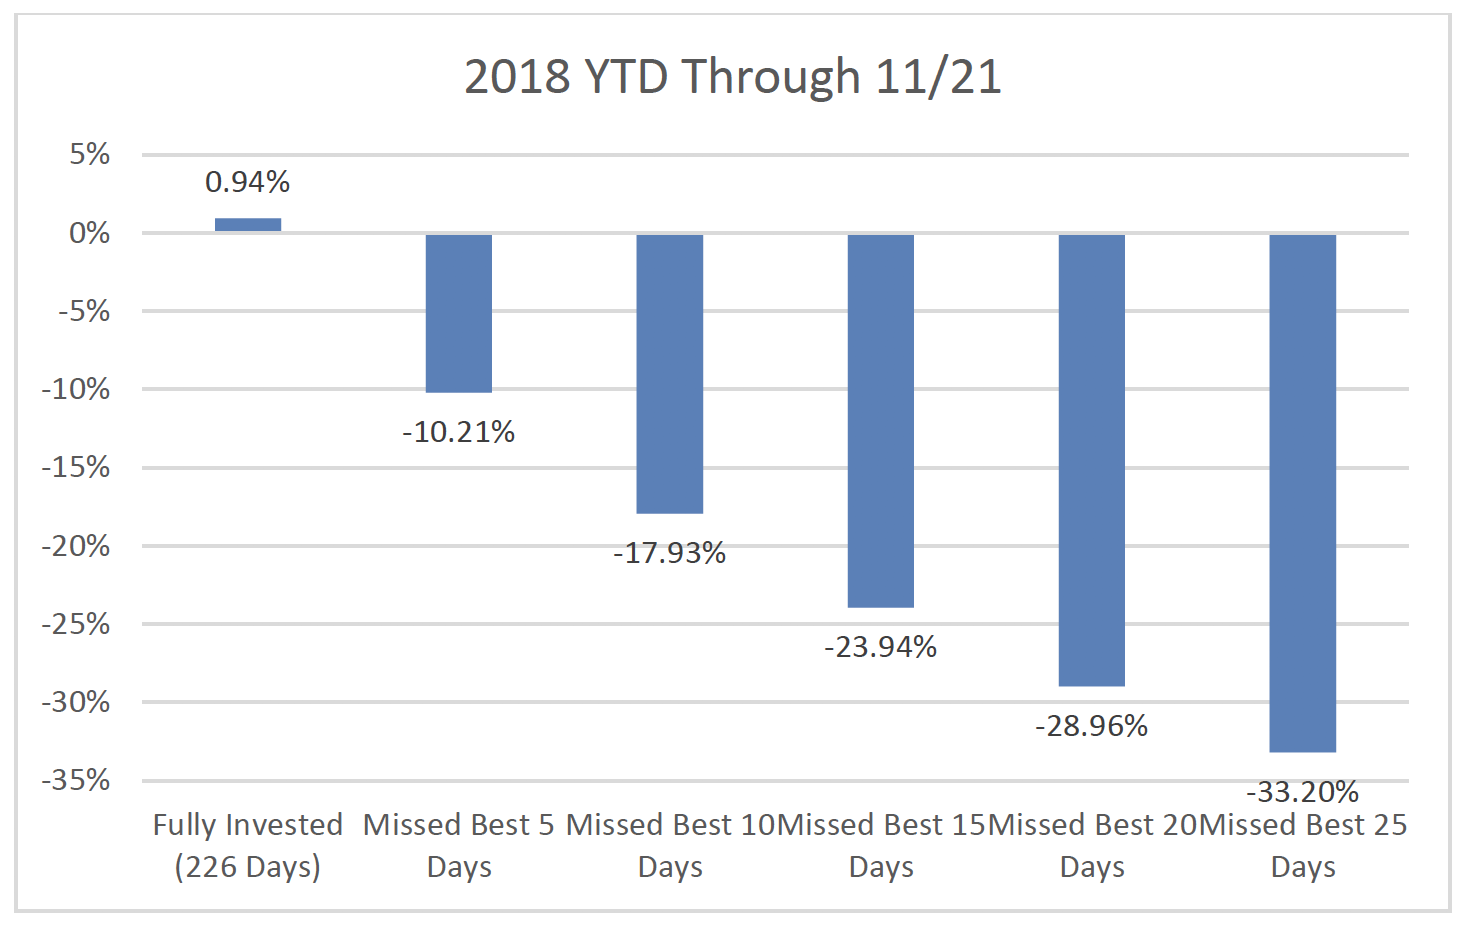
2018 year to date (through November 2018)
2018 is a study in contrasts when compared to 2017. While the S&P 500 through November 21st is up slightly, it was down -4% for the year by the middle of February, at the conclusion of a -10% decline from late January highs. The VIX has averaged almost 16 for the year (still considerably below its 30-year average of over 19) which is volatility that many investors have grown unaccustomed to.
This period is also uncharacteristic in another way: this is one of the few intervals when the absolute magnitude of declines was considerably larger than advances. The other periods we consider don’t display that tendency, and the long run data, which we speak to later, don’t show it either.
Nonetheless, in a volatile year, in which markets have not advanced far from their starting point, the up days are critical to holding ground. Missing just the top five days would render an unchanged result into a -10% disaster.
Putting it all together
Setting aside dividends, the average daily price return since 1928 has been not far from 0—just 0.03%. The average up day is around the same as the average down day: +/- 0.75%. If that’s the case, how do you make money? Don’t the up and down days cancel each other out? No—on average 52.3% of the trading days have been positive. That makes a profound difference. And that 0.03% per day? It equates to almost 8% per year.
In both up markets and down markets, remaining fully invested and not missing the 10 best days is a dominant strategy. However, this observation doesn’t tell you much; it’s not a revelation that benefiting from the best up days is going to be better than missing them. What isn’t as obvious, on the surface at least, is how important that is. The reason is the power of compounding. Simply put, even a 3% advantage per year, if compounded over multiple years (and most investors should have investment horizons that span two decades or more) has a profound effect on dollar returns3.
Another aspect, which market timing enthusiasts often miss, is the impact of taxes. Simply put, tax efficiency, and smartly managing gains realizations, is one of the most important aspects of long-term wealth accumulation. While we can’t put a number on it—actual results depend on situational factors and the types of vehicles used to gain equity exposure—all things equal, the realization of even the simplest long-term capital gains anytime in the middle of a family’s investment lifetime will destroy value.
The even more subtle point, and the one which is harder to admit to, is that this effect—the importance of staying invested and benefitting from the up days—is much more important in down markets generally, and of the most importance in the most tumultuously down markets. Even though equity returns are not symmetrical and there is some negative skew in capital markets, volatility is a blessing and a curse. The biggest up days are inevitably found amid the most volatile periods, when even the nerviest investor’s mettle is tested. Worse, in those fast-moving periods, the up days come without warning.
Simply put, the notion of sidestepping extreme market volatility and biding one’s time seems to make sense. But, doing so, for virtually every investor, will come at the cost of missing the best days to be invested. Careless market timing and missing just a few days out of thousands of trading days, costs real money.
Notes
- In this analysis, we look at the SPX index from Bloomberg LP (a time series available from January 3rd, 1928), which doesn’t include dividends, and the SPXT index (a total return version) available since the late 1980s. Over time, dividends for the S&P 500 have averaged around 3%-4% a year, although have been lower recently.
- December 2017 through June 2019.
- Specifically, the 3.15% annualized difference between being fully invested and missing the best 10 days since the Dot-com bubble of the 1990s would mean a difference between a $9.14 terminal value per dollar invested and a $4.56 value.
These materials are provided for informational purposes only and no portion of this commentary is to be construed as a solicitation to effect a securities transaction or the rendering of personalized investment, tax or legal advice. Past performance is no guarantee of future results and there can be no assurance the views and opinions expressed herein will come to pass.
Investing involves risk, including the potential loss of principal.
Historical statements about FFT’s portfolio weightings are reflective of aggregate client account holdings; however, individual account composition may have varied during the time periods stated. Any reference to a market index is included for illustrative purposes only, as an index is not a security in which an investment can be made.
Certain of the information discussed herein has been obtained from sources the Firm deems to be reliable, but FFT makes no representations with regard to the accuracy, completeness or timeliness of any information prepared by a third party and assumes no liability for the reliance thereon.
FFT Wealth Management (‘Forbes Family Trust’) is a registered investment adviser. For additional information about FFT, please visit our website at www.forbrsfamilytrust.com www.adviserinfo.sec.govor consult the Firm’s Form ADV disclosure documents, the most recent versions of which are available on the SEC Investment Adviser Public Disclosure website at www.adviserinfo.sec.gov.